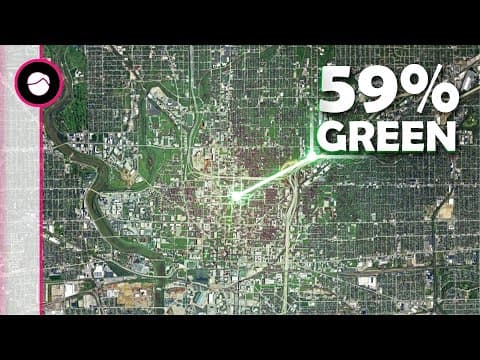
This blog post investigates which city is the greenest in the world using a data-driven approach that analyzes satellite images to quantify green spaces. The analysis reveals that U.S. cities dominate the top rankings due to their design and abundance of green clusters, with Tulsa being crowned the greenest city.
When we think about the greenest cities, we often consider factors like renewable energy and sustainability. However, this analysis takes a different approach by focusing on the literal greenness of cities—specifically, which city has the most green color visible from above. Using satellite imagery from Google Earth, we can estimate the amount of greenery in urban areas.
To determine the greenest city, I gathered the coordinates of 933 major cities worldwide and utilized Google Earth to capture images from an altitude of 15 kilometers. A simple script was created to automate the process of taking screenshots of each city. After capturing the images, I cropped them for analysis.
One concern with using satellite images is seasonality. Cities in winter will appear less green than in summer. Google Earth typically captures images during seasons with the clearest views, often in summer for higher latitudes and during dry seasons in tropical regions. While this does not guarantee that the images represent the greenest state of a city, it provides a consistent basis for comparison.
To quantify greenness, I needed to define what constitutes a green pixel. Using the HSL color model, green is defined by a hue range of 80 to 150, with saturation from 10 to 100 and lightness between 5 and 80. However, this definition can miss some green areas, as certain pixels may appear greener at lower lightness levels. To refine the analysis, I expanded the hue threshold to 200, which helped capture more green areas but also included some blue pixels from nearby water bodies.
To ensure an accurate representation of greenery, it was essential to differentiate between water and vegetation. This task proved challenging due to the overlapping hues of water and greenery. To tackle this, I employed a Machine Learning algorithm trained on labeled images of water and non-water areas. Although the algorithm was not perfect, it significantly improved the accuracy of identifying water pixels, allowing for a clearer calculation of green areas.
With the water pixels identified, I could calculate the greenness of each city by dividing the number of green pixels by the total number of pixels minus the blue pixels. The initial results indicated that Ibague, Colombia, had an astonishing 77.7% green pixels. However, this figure was misleading due to the city's small size and the coordinates not being centered within the urban area.
To refine the results, I analyzed the number of distinct green clusters within each city. While Ibague had a high percentage of green pixels, it lacked many distinct green clusters. In contrast, cities like San Antonio had numerous small, scattered green clusters, indicating a more urban-integrated greenery.
To enhance accuracy, I captured additional screenshots at altitudes of 10 km and 5 km. This provided six metrics for each city: the percentage of green pixels and the number of green clusters at each altitude. To weigh the results appropriately, I assigned more importance to the lower altitude images, which covered less area outside the city and reduced the risk of including non-urban greenery.
After thorough analysis, the least green cities identified were:
Conversely, the top ten greenest cities were:
The dominance of U.S. cities in the top rankings can be attributed to their urban design, which often includes abundant green clusters and a high percentage of green pixels. For instance, Tulsa features trees lining every block and spacious yards, contributing to its high greenness score. In contrast, cities like Düsseldorf in Germany, while green, have large areas with minimal greenery due to urban infrastructure.
Other notable green cities outside the U.S. include:
This analysis provides a unique perspective on urban greenness, highlighting the importance of both the quantity and distribution of green spaces within cities. As urban areas continue to grow, understanding and promoting greenery can enhance the quality of life for residents. The findings encourage city planners and policymakers to consider green space integration in urban design to foster healthier, more sustainable environments.
Thank you for reading, and I hope you found this exploration of the greenest cities insightful!