This article explores the capabilities of Claude for Excel in creating financial dashboards. After testing it with various financial models, including income statements, balance sheets, and cash flows, Claude demonstrated impressive ability to generate KPI dashboards and summarized financial statements. Despite some formatting and data handling issues, Claude shows potential to automate complex financial reporting tasks, raising questions about the future role of CFOs.
I've built a career creating beautiful dashboards in finance and accounting. Claude for Excel claims it can replace this work by creating dashboards entirely from basic prompts. I had to find out: is my job safe, or will Claude replace me?
In this article, I will walk you through my experience creating three dashboards using Claude for Excel: a summary financials dashboard, a KPI dashboard, and a comparison dashboard. We'll see how well Claude performs.
I started with a dataset consisting of an income statement, balance sheet, and cash flows — a three-statement model with actuals through June 2025 and projections through December 2026. These statements are interconnected, with net income pulling from the income statement and cash flows dynamically linked to both the balance sheet and income statement.
To avoid overwhelming clients with too much information, I created a summarized version using a helper column for summary groupings across all three statements. This summary tab aggregates data monthly, quarterly, annually, and custom ranges.
I gave Claude the file with three tabs and prompted it to create a summarized view of all three financial statements based on the summary groupings. I requested monthly, quarterly, annual views, TTM, and year-to-date columns, matching my company's logo color scheme.
Unfortunately, Claude struggled with this file. It slowed down Excel significantly and eventually crashed multiple times. After several attempts and troubleshooting, I decided to move on to a cleaner, more robust financial model.
The new model included a drivers tab for assumptions, an unpivoted table of actuals from accounting software, error checks, a list tab for key dates, and a data summary tab.
I asked Claude to create a dynamic KPI dashboard pointing to the data summary tab and matching my company's branding.
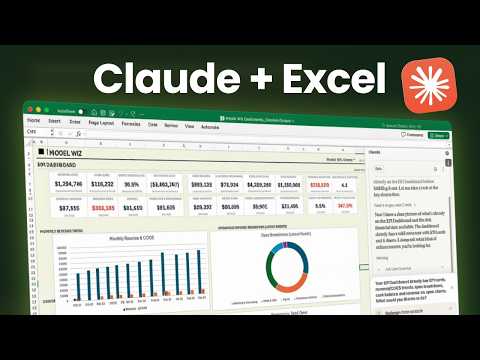
Claude successfully created a KPI dashboard with 16 dynamic KPI cards and four charts, including an OPEX breakdown and cash trend line. It pulled data directly from the summary tab using formulas and sum functions.
However, some charts initially showed no data because the rows were hidden. Claude did not detect this issue, which could be problematic if the dashboard were shared with stakeholders without review.
Using my own tool, Model Wiz, I created a similar dashboard connected to QuickBooks Online data. Model Wiz included cash flows, which Claude's dashboard initially lacked due to the data structure.
I challenged Claude to extend the financial statements tab to add a cash flow section, calculating actuals from the income statement and balance sheet, and summarizing the data similarly.
Claude impressed me by generating a statement of cash flows, populating it correctly, applying conditional formatting, and verifying that assets equaled liabilities plus equity.
There were some formatting issues, such as smooshed rows, but Claude quickly identified and fixed them.
I asked Claude to create a new tab with a summarized financials view of all three statements, including all months, years, quarters, TTM, and year-to-date data.
Claude planned the build, used Python to generate over 1,400 formulas efficiently, and applied formatting such as bolding, borders, and freeze panes.
The model was fully balanced, and the summary tab updated successfully.
Claude demonstrated remarkable ability to create complex financial dashboards quickly, something my team has spent years developing.
However, there were some limitations:
The quality of AI output depends heavily on the quality and structure of input data — garbage in, garbage out.
To address messy data, I use Maxio, which automates and integrates billing, revenue recognition, and investor-grade metrics into a unified source of truth. Claude connects to Maxio via their MCP, pulling structured financial data rather than messy CSVs.
I also developed a plugin called Close Autopilot that audits billing data, catches exceptions, and notifies the right people to fix issues, streamlining the pre-close process.
Claude for Excel shows great promise in automating financial dashboard creation, capable of handling complex models and generating detailed reports rapidly.
While it may not yet fully replace the nuanced work of a fractional CFO, it certainly raises questions about how CFO roles will evolve with AI assistance.
I'm curious about your thoughts on this technology and its impact on finance professionals. Feel free to share your views.
If you're interested in building full financial models with Claude, I recommend exploring tutorials and tools that integrate AI with structured financial data.
I'm Josh, your CFO guy, and I'll catch you in the next discussion.