This blog post explores the application of seasonal tendencies in higher time frame analysis, focusing on the New Zealand Dollar (Kiwi). It discusses how to identify bearish seasonal trends, their implications for trading strategies, and how they can lead to significant price movements. The post emphasizes the importance of understanding these tendencies to align with market shifts and improve trading outcomes.
In this lesson, we delve deeper into the application of seasonal tendencies in higher time frame analysis, specifically focusing on the New Zealand Dollar, commonly referred to as the Kiwi. Building on previous lessons, we will explore how bearish seasonal tendencies can be utilized to inform trading strategies and anticipate market movements.
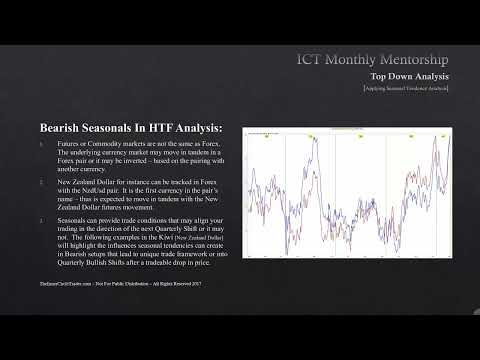
Seasonal tendencies refer to the historical patterns of price movements that occur at specific times of the year. These patterns can be particularly useful in the futures market, where they may not always align with the behavior of currency pairs. For instance, while the Canadian Dollar may exhibit bullish seasonal tendencies, the USD/CAD pair could behave inversely, leading to potential confusion for traders.
In this lesson, we will focus on the Kiwi, a commodity currency that generally moves in tandem with its seasonal tendencies. By analyzing historical data, we can identify periods where the Kiwi is likely to experience significant price swings, particularly in bearish conditions.
Higher time frame charts—monthly, weekly, and daily—are crucial for identifying powerful price movements in the foreign exchange market. By leveraging seasonal tendencies as a roadmap, traders can better understand the most probable price directions during specific times of the year. This approach is not limited to currencies; it can be applied across various markets.
To illustrate the concept of seasonal tendencies, we will examine a chart that compares long-term and short-term price movements of the Kiwi. The blue line represents 19 years of data, while the red line represents 15 years. When both lines move in the same direction, it indicates a high probability of a seasonal tendency.
For the Kiwi, significant declines are expected at certain times of the year, particularly during the June and December futures contract months. Understanding these patterns allows traders to position themselves effectively for potential price movements.
While focusing on bearish seasonal tendencies, it is essential to recognize that these declines can lead to bullish quarterly shifts. For instance, after a bearish move in May, the market often rallies in June and July, creating opportunities for traders to capitalize on both bearish and bullish trends.
To validate the effectiveness of seasonal tendencies, we will review historical price movements of the Kiwi from 2007 to 2016. This analysis will highlight how understanding these tendencies can enhance trading strategies.
Understanding seasonal tendencies is a powerful tool for traders looking to navigate the complexities of the foreign exchange market. By recognizing the historical patterns of the Kiwi and aligning trading strategies with these tendencies, traders can enhance their decision-making processes and improve their chances of success.
As we continue to explore these concepts in future lessons, remember that while seasonal tendencies provide valuable insights, they should be used in conjunction with current market conditions and technical analysis. By blending these approaches, traders can create high-probability setups that lead to profitable outcomes in their trading endeavors.