This article provides a comprehensive breakdown of professional trading strategies focusing on market structure analysis across multiple time frames. It explains how to map market structure from higher to lower time frames, develop trade bias, identify swing ranges, and use supply and demand zones for precise entries. The importance of patience, psychology, and a methodical approach to avoid false moves and improve trading consistency is emphasized.
In this detailed guide, we explore how to trade market structure like a professional by analyzing price action across multiple time frames, developing a clear trade bias, and identifying optimal entry points. This approach is based on a live trading session conducted with students, revealing the raw and unfiltered thought process behind successful trading.
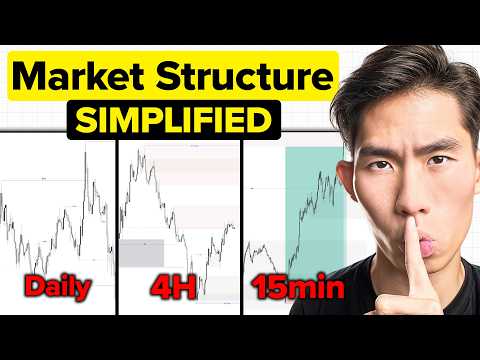
The first and most crucial step in professional trading is to map out the market structure starting from the higher time frame down to the lower time frame. This process helps traders identify the overall trend direction and determine who is in control of the price — whether demand or supply dominates.
The market can only move in three ways:
If the market is not moving up, it is moving down; if not up or down, it is sideways.
Start by analyzing the daily chart to identify the swing highs and lows, and the breaks of structure. For example, in an uptrend, price creates higher highs and higher lows. Mark these clearly:
This helps define the bullish break of structure and the swing range within which you will focus your trading efforts.
The swing range is the price range between the most recent significant swing high and swing low. This range narrows your focus and helps avoid distractions from price movements outside this range.
Within the swing range, the internal structure consists of smaller breaks of structure. These internal breaks indicate short-term shifts in market sentiment.
For example, if price takes out the last internal low, it signals a bearish shift in the short term, often facilitating a pullback within an overall uptrend.
Price does not move up indefinitely; gravity pulls it back to fair value. Pullbacks allow institutions to enter long positions at better prices, creating demand zones.
When price breaks a significant low, it could indicate either:
The key to distinguishing between these is to observe the follow-through:
Patience is essential; do not rush into trades without confirmation.
Without a clear bias, it is best to stay out of the market. A good trade idea should be obvious and compelling, giving you the confidence to execute.
After establishing the daily bias, move to the medium time frame (4-hour or 1-hour charts) to narrow your focus further.
Identify the swing highs and lows and internal breaks of structure on the 4-hour chart. This reduces the trading range further, allowing you to focus on a smaller price area.
Focus on what price is doing right now, not on past or future movements. This mindset helps avoid emotional trading and keeps you aligned with the current market flow.
Within the narrowed swing range, mark key supply and demand zones, order blocks, and flip zones. These points of interest are potential areas where price may reverse or continue.
Rank these zones by probability based on their proximity to recent structural highs or lows and confluences such as liquidity sweeps and inducements.
For precise entries, move down to lower time frames (15-minute, 5-minute, or 1-minute charts) to spot entry models such as liquidity sweeps, market shifts, and pullbacks to flip zones.
Choose time frames that suit your trading style and allow you to identify clear entry signals.
Set realistic take profit (TP) and stop loss (SL) levels based on points of interest. For example, if entering a long trade at a flip zone, target the nearest supply zone and place SL below the demand zone.
Understand that no trade idea is guaranteed. Market conditions can change rapidly due to various factors such as liquidity, supply and demand dynamics, timing, and news.
Professional traders experience losses and emotions but do not let emotions affect their execution. Consistency comes from following a mechanical trading plan and sticking to it despite setbacks.
Every trade outcome is random; past losses do not predict future results. Focus on executing your plan and managing risk.
The hardest part of trading is not spotting setups but ignoring distractions and sticking to a methodical process. By following this multi-time frame market structure analysis and focusing only on relevant price action, traders can improve their consistency and profitability.
Remember, patience and discipline are key. Wait for the market to reveal its intentions and react accordingly.
Happy trading!