Welcome to this detailed guide on using Deepvue (DVW) to apply the CANSLIM methodology for trading stocks effectively. Whether you are new to CANSLIM or looking to enhance your trading workflow, this article will walk you through the essential features and tools in Deepvue that help identify leading stocks, analyze market conditions, and streamline your trading process.
Deepvue is a powerful trading platform designed to support CANSLIM traders by providing customizable charts, data panels, screeners, and AI-driven research tools. The platform is continuously updated based on user feedback to improve usability and add practical features.
CANSLIM is a growth stock investing strategy focusing on key fundamental and technical indicators such as earnings growth, relative strength, and market leadership.
Setting Up Your Chart for CANSLIM Trading
Key Indicators to Add
As a CANSLIM trader, you will want to add the following to your charts:
- Relative Strength (RS) Line
- Moving Averages (e.g., 21 EMA, 50 SMA, 200 SMA)
- Volume and Enhanced Volume
How to Add Indicators
- Go to the Screener Module in Deepvue.
- Click the Indicators and Strategies icon on the top bar.
- Search for the indicator you want (e.g., "relative strength line").
- Add it to your chart.
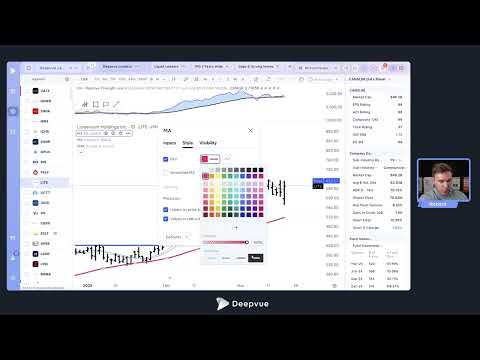
- Customize the indicator by double-clicking it or clicking the gear icon next to its name.
Customizing the Relative Strength Line
- Change the signal line to an exponential moving average (EMA).
- Adjust colors and styles for clarity.
- The RS line compares the stock price to the SPY ETF, focusing on the trend rather than the absolute value.
Adding Moving Averages
- Add multiple moving averages such as 21 EMA (purple), 50 SMA (red), and 200 SMA (black).
- Adjust the length and color of each moving average.
Adding Volume Indicators
- Add normal volume, enhanced volume (highlighting pocket pivots), and dollar volume.
- Move volume indicators to a separate pane below the price chart for better visibility.
- Customize colors to highlight high and low volume days.
Chart Customization Tips
- Choose between bar charts or candlesticks based on your preference.
- Adjust bar thickness and colors.
- Switch between logarithmic and arithmetic scales by right-clicking the price scale.
- Use auto-scaling to keep charts readable when switching stocks.
Using the Data Panel and Stats Table
Data Panel
- Displays stock-specific data points such as market cap, EPS rating, composite rating, and volume metrics.
- Fully customizable: add, remove, or rearrange data points.
- Can be positioned anywhere on your dashboard.
Stats Table
- Shows earnings and sales data over multiple quarters.
- Highlights acceleration in growth with visual cues.
- Displays estimates alongside reported values to anticipate future performance.
- Can be toggled on/off and positioned above or below charts.
Adding Data Points
- Hover over a category header in the data panel and click "Add Data Point".
- Search for CANSLIM-relevant metrics like margins, EPS growth, fund ownership, and industry ranks.
- Remove data points by clicking the X next to them.
Industry and Subindustry Ranks
- Add industry and subindustry rank data points to identify leading sectors.
- Click on ranks to view top stocks within that group.
Creating and Managing Dashboards
- Dashboards allow you to combine charts, data panels, watch lists, and other widgets.
- Create a new dashboard from scratch and add apps like Theme Tracker, Industry Rank, and Stats Table.
- Customize layout by dragging and resizing widgets.
- Save multiple dashboards for different trading strategies or market conditions.
Theme Tracker
- Tracks performance of key market themes over various time frames (daily, weekly, monthly).
- Helps identify leading and developing themes to focus your trading.
- Click on themes to see constituent stocks ranked by relative strength.
- Ranks sectors, groups, industries, and subindustries based on performance.
- Shows daily changes in rank to spot rotation and emerging opportunities.
- Click to view stocks within top-ranked groups.
Using Screeners to Find Market Leaders
Deepvue Leader Screen
- A preset screen that filters stocks based on relative strength, liquidity, EPS growth, and sales growth.
- Typically returns 250-350 stocks depending on market conditions.
Liquid Leader Screen
- Similar to the leader screen but with higher liquidity requirements.
- Returns fewer stocks, ideal for full-time traders seeking more orderly stocks.
IPO Screen
- Identifies stocks that have IPOed recently with minimum liquidity and price criteria.
- Useful for spotting emerging leaders during their initial moves.
Combining Screens
- Combine multiple screens or watch lists into one to avoid duplicate symbols and streamline review.
- Useful for integrating different CANSLIM criteria like earnings growth, pullback buys, and new highs.
Leveraging AI-Powered Research with DV AI
- Deepvue integrates AI to help research catalysts behind price moves directly within the platform.
- Right-click any bar with a significant move and select "Ask DV AI" to get a summary of news, earnings beats, analyst upgrades, and more.
- Use preset prompts or create custom prompts to analyze stocks, themes, or market conditions.
- Examples of prompts include:
- "Who are the main competitors of [stock]?"
- "What are recent news catalysts for [stock]?"
- "Analyze the N factor of [stock]" (CANSLIM's "What's New and Different" factor).
Creating Custom Prompts
- Access the prompt library and create your own prompts with detailed instructions.
- Use natural language to describe what you want the AI to analyze or generate.
- Save prompts for quick access and reuse.
Using AI for Market Theme Analysis
- Provide a watch list or screen as context to DV AI.
- Ask it to identify key themes represented in your stock universe.
Market Condition Indicators
Market Cycle Indicator
- Tracks whether the market (e.g., QQQ or SPY) is above or below a chosen moving average (e.g., 21 EMA).
- Counts days in uptrend or downtrend cycles to help time CANSLIM trades.
Stage Analysis
- Colors price action based on market stages (1 to 4) inspired by Stan Weinstein.
- Helps identify favorable conditions (Stage 2 uptrends) for CANSLIM trading.
Additional Features and Tips
- Multiple time frames can be viewed side-by-side for comprehensive analysis.
- Save chart templates with preferred indicators and layouts.
- Use watch lists with color-coded tags to organize stocks by setup or trade status.
- Bookmark favorite screens, dashboards, and watch lists for quick access.
- Alerts based on watch lists and conditions are coming soon.
- Broker integrations and journaling modules are in development to enhance trading workflow.
Getting Started with Deepvue
- New users can try Deepvue free for one month using the code "Richard" at checkout.
- The platform is accessible via web and has an iPhone app.
- One-on-one onboarding sessions are available to help new users get started.
Conclusion
Deepvue offers a comprehensive and customizable platform tailored for CANSLIM traders. From setting up essential indicators and data panels to leveraging AI for research and tracking market themes, Deepvue streamlines the process of finding and trading market leaders. Continuous updates and user-driven improvements ensure the platform evolves to meet traders' needs.
Explore Deepvue today to enhance your CANSLIM trading strategy and stay ahead in the markets.