Stanley Druckenmiller reveals the mechanical sequence behind gold and silver price movements during geopolitical crises and oil shocks. Despite recent price drops amid global turmoil, historical patterns show a four-phase recovery leading to significant gains. The current structural conditions in 2026 are more extreme than ever, suggesting an unprecedented surge in precious metals once the suppression phase ends. Investors should watch the dollar index and 10-year Treasury yield as key reversal,
Gold and silver investors have been puzzled recently. Despite geopolitical chaos, central banks buying gold at high rates, and soaring national debt, gold and silver prices have fallen significantly. Stanley Druckenmiller, with over 40 years of experience studying precious metals during crises, explains why this apparent contradiction occurs and what it means for investors.
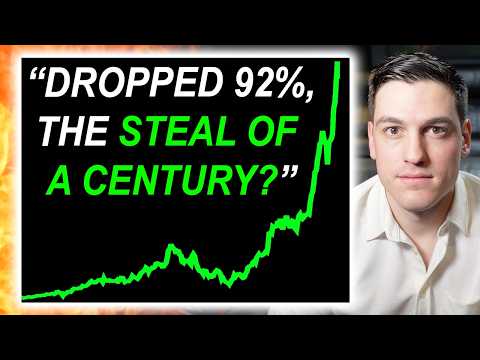
Investors followed the conventional wisdom: buy gold and silver during geopolitical turmoil. Yet, gold ETFs and silver positions have declined, with silver dropping over 40% from its January highs. Meanwhile, bombs fall in the Middle East, central banks continue buying gold aggressively, and the U.S. national debt has surpassed $39 trillion.
Druckenmiller challenges the surface-level explanations often given by financial media and urges investors to understand the underlying mechanism causing this price behavior. Without this understanding, investors risk making costly mistakes at critical moments.
Druckenmiller outlines a six-step mechanical sequence explaining why gold falls during wars and oil shocks:
This arithmetic explains why gold prices fall despite geopolitical turmoil and why this pattern has repeated after every major oil shock in the last 50 years.
Druckenmiller presents a consistent four-phase recovery pattern observed after every major oil shock since 1973:
Historical examples include:
The current cycle is more extreme due to several structural factors:
These factors suggest the upcoming recovery in gold and silver prices will be larger than any previous cycle.
Silver differs from gold because it is both a monetary and industrial metal. While gold leads the initial move, silver tends to lag initially but then outperforms during the structural phase due to:
Investors who accumulate silver during the suppression phase stand to gain the most from its characteristic higher velocity move.
Druckenmiller highlights two critical indicators signaling the end of the suppression phase and the start of the structural recovery:
These indicators are more reliable than daily war news or oil prices for timing the gold and silver recovery.
Major institutions maintain or raise their gold price targets despite current suppression:
Investors fall into two categories:
The current sell-off in gold and silver is a temporary mechanical suppression caused by elevated bond yields, a strong dollar, and institutional selling amid geopolitical turmoil. Historical patterns and structural conditions suggest a significant and unprecedented recovery is imminent. Investors should focus on the underlying monetary mechanisms and watch key indicators like the dollar index and Treasury yields to navigate this cycle successfully.
Understanding this mechanism is crucial to avoid costly mistakes and position for what Druckenmiller calls the "unthinkable" move in gold and silver.
If you are a gold or silver investor, recognizing which phase of the cycle we are in can shape your investment decisions and potentially build generational wealth.