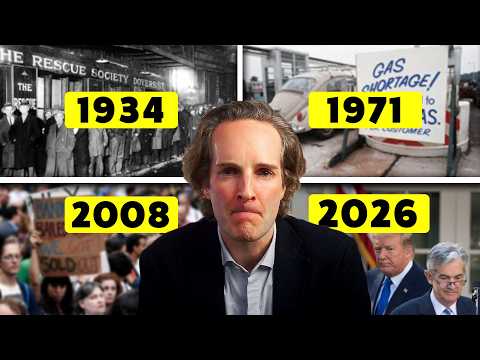
Gold's biggest price surges in the last century were each preceded by four consistent signals: unsustainable government debt, changes in monetary rules, negative real interest rates, and central banks buying gold. Understanding these signals helps investors recognize when gold is poised for a major rally, as current conditions mirror past patterns seen in 1934, 1971, and 2008.
Gold has experienced some of the most dramatic price moves in history, such as rising from $35 to $850, $250 to $1,900, and $1,050 to nearly $4,800. What’s fascinating is that every one of these massive gold rallies was preceded by the exact same four signals — not sometimes, not in certain conditions, but every single time.
Today, all four signals are flashing again. This article will walk you through these four signals, demonstrate how history has repeated itself across nearly a century, and explain where we stand with gold right now.
The first signal is when government debt becomes mathematically impossible to repay. This is not just about having a large debt, but reaching a level where paying it back is unfeasible. At this point, governments have two options:
Historically, Western governments avoid defaulting because it is unpopular and damaging. Instead, they resort to devaluing their currency.
For example, in the 1930s during the Great Depression, U.S. debt soared, and President Franklin D. Roosevelt issued an executive order confiscating private gold and revaluing it from $20 to $35 per ounce, effectively increasing gold’s price by 69% overnight.
In the 1970s, the U.S. again faced unsustainable debt levels, leading to the suspension of the gold standard by President Nixon in 1971. This caused the dollar to drop 30% over the next decade while gold surged from $35 to $850.
After the 2008 financial crisis, U.S. debt doubled due to bailouts and stimulus, and gold rose from $250 to $1,900.
Currently, the U.S. national debt is approaching $40 trillion, which is about $300,000 per household — six times the average household income — making repayment impossible.
When debt becomes unmanageable, governments change the rules of the monetary system to manage the crisis. This includes actions like:
For instance, the recent U.S. legislation requires stablecoins to be backed by U.S. government debt, effectively using the crypto ecosystem to fund the deficit.
These rule changes often happen quietly or during times when public attention is low, such as mid-August Sundays.
The third signal is when savings accounts and bonds start losing money in real terms. Even if banks pay nominal interest rates of 2-4%, inflation often exceeds this, causing the purchasing power of savings to decline.
For example, if inflation is 6% and your bank pays 4%, your real return is negative 2%, meaning your money loses value over time.
Historically, after Nixon’s suspension of the gold standard, inflation reached 14%, while savings accounts and bonds paid much less, eroding wealth.
Post-2008, the Federal Reserve lowered interest rates to near zero, making it effectively impossible to earn a real return on safe assets.
Today, inflation remains high, and the Fed is cutting rates, pushing investors toward real assets like gold and real estate.
The final signal is when central banks, the entities that print money, begin buying gold. This is a strong institutional vote of no confidence in paper currencies.
Before 1971, countries like France, Britain, and Switzerland were converting dollars to gold rapidly, anticipating the collapse of the gold standard.
After the 2008 financial crisis, emerging market central banks began buying gold for the first time in decades. This trend has continued for 15 consecutive years, with central banks purchasing nearly 1,000 tons of gold in 2025 alone.
Countries such as Poland, China, India, Turkey, Kazakhstan, and the Czech Republic are diversifying their reserves away from the U.S. dollar.
Goldman Sachs has called this the most aggressive central bank gold buying cycle in modern history, projecting gold could reach $5,400 by the end of the year.
| Year | Signal 1: Debt Crisis | Signal 2: Rule Changes | Signal 3: Negative Real Rates | Signal 4: Central Bank Gold Buying | Gold Price Move |
|---|---|---|---|---|---|
| 1934 | Yes | Yes | Yes | Yes | +69% overnight |
| 1971 | Yes | Yes | Yes | Yes | +2,300% over decade |
| 2008 | Yes | Yes | Yes | Yes | +660% (250 to 1900) |
| 2026* | Yes | Yes | Yes | Yes | Pattern emerging |
*Current year, pattern developing.
For example, if a mining company’s cost to extract gold is $1,200 per ounce and gold rises from $4,800 to $6,000, their profit margin increases significantly.
The four signals that have historically preceded gold explosions are all present today. While this does not guarantee immediate gains, it suggests that gold is positioned for a significant move.
Investors should educate themselves, diversify their portfolios, and manage risk carefully. For those interested in deeper research, free reports and masterclasses are available to help understand these dynamics.
Understanding these patterns can help you avoid hindsight regrets and make informed decisions about gold and other assets.
Thank you for reading. Stay informed and invest wisely.
Note: This article is for informational purposes only and does not constitute financial advice.