This blog post explores the concepts of market structure and fair value areas, essential tools for traders to determine price action direction. It explains how to identify intermediate term highs and lows, the significance of fair value areas, and how to apply these concepts across different time frames for effective trading strategies.
In the world of trading, grasping the direction of price action is crucial for success. This blog post delves into two fundamental concepts that can significantly enhance your trading strategy: market structure and fair value areas. By the end of this article, you will have a solid understanding of how to identify these elements and utilize them effectively in your trading.
Before diving into market structure, it's essential to revisit the concept of PD rays discussed in the previous video. PD rays represent the price action's tendency to move towards specific points of interest, which include fair value gaps, fair value areas, and swing points. While fair value areas are not necessarily targets for trading, they serve as critical reference points for making informed trading decisions.
To effectively analyze price action, traders should start by marking out fair value gaps and swing points on the daily time frame. For instance, when examining the Euro GBP chart, one should identify swing lows and swing highs. These points provide a framework for understanding where price action is likely to move next.
Understanding these swing points is vital as they help traders anticipate future price movements and identify potential entry and exit points.
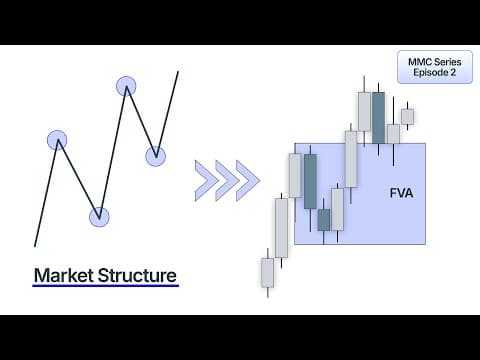
Market structure is a critical concept that helps traders understand the overall trend and direction of price action. In this context, we focus on two key elements: intermediate term highs and intermediate term lows.
Recognizing these structures allows traders to gauge the market's direction and make informed decisions about potential trades.
When analyzing market structure, it is crucial to consider different time frames. Start with the daily time frame to identify swing points, then drill down to the 4-hour and 1-hour time frames to spot intermediate term highs and lows. This multi-time frame analysis provides a comprehensive view of market dynamics and helps traders pinpoint potential trading opportunities.
A fair value area is defined as the range between an intermediate term high and an intermediate term low. It represents a zone where the market offers participants a fair chance to engage in trading. Understanding fair value areas is essential for recognizing where price action may retrace or continue its trend.
The market aims to provide fair value to all participants. When price moves rapidly in one direction, it may not offer fair value to buyers or sellers. Therefore, retracements often occur to allow for a more balanced opportunity for all market participants. This is where fair value areas come into play, as they indicate zones where price action has previously established equilibrium.
To apply these concepts in real-time trading, follow these steps:
Understanding market structure and fair value areas is essential for any trader looking to enhance their trading strategy. By identifying intermediate term highs and lows and recognizing fair value areas, traders can make more informed decisions about their trades. Remember, the key to successful trading lies in continuous study and practice. Start applying these concepts to your trading routine, and you will likely see improvements in your ability to predict price action direction.
For further study, practice marking out swing points and fair value gaps on various charts. Analyze how these concepts play out in real-time price action to deepen your understanding and improve your trading skills.