This blog post provides a comprehensive tutorial on how to create a rainfall map and estimate the rainfall erosivity factor (R-Factor) using ArcGIS. It covers data preparation, interpolation methods, and the calculation of the R-Factor, along with practical steps and tips for effective mapping.
In this tutorial, we will explore how to produce a map that shows the mean annual rainfall and estimate the rainfall erosivity factor (R-Factor) using ArcGIS. Rainfall erosivity is a crucial component of the Revised Universal Soil Loss Equation (RUSLE), which helps in understanding soil erosion processes. The R-Factor is calculated using the formula:
R = 1.03 * P,
where P represents the mean annual rainfall.
To begin, we need to gather rainfall data from various stations over a period of 20 years, from 1999 to 2019. This data will be used to calculate the mean annual rainfall for each station. The rainfall data is organized in a table format, showing the annual rainfall for each year across 16 different stations.
The average rainfall for the 20-year span is calculated, which will serve as the basis for our analysis.
Once the data is prepared, we will launch ArcGIS to begin the mapping process. Follow these steps:
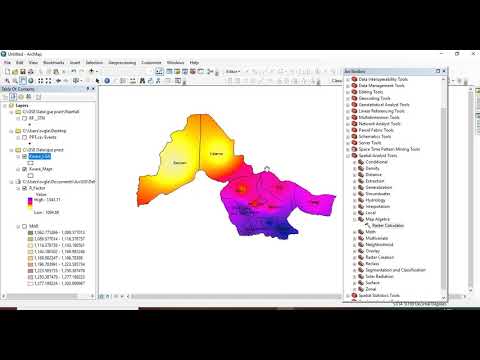
Next, we will add the boundary data for the area of interest, which in this case is Kwara State. This boundary map will help us visualize the rainfall distribution across the state.
To create a comprehensive rainfall map for the entire Kwara State, we need to interpolate the mean annual rainfall data. We will use the Inverse Distance Weighted (IDW) method for this purpose:
With the interpolated mean annual rainfall data ready, we can now calculate the R-Factor:
After calculating the R-Factor, we can visualize the results:
In this tutorial, we successfully created a rainfall map and estimated the rainfall erosivity factor using ArcGIS. By following the outlined steps, you can visualize areas with high, medium, and low rainfall erosivity factors, which is essential for understanding soil erosion risks in the region. For further learning, consider watching previous videos on creating map layouts, adding titles, legends, and scales to your maps. Thank you for following along!