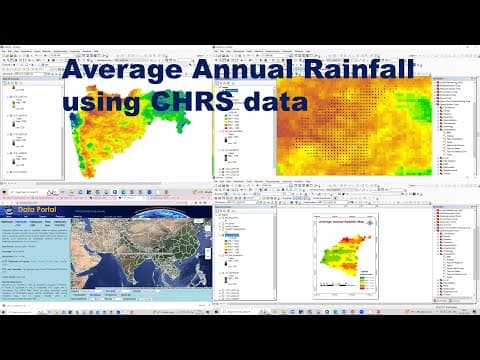
This blog post provides a comprehensive guide on how to create an average annual rainfall map using CHRS data over a five-year period. It covers downloading rainfall data, processing it in ArcMap, calculating averages, and visualizing the results.
In this blog post, we will explore how to prepare an average annual rainfall map using CHRS data, specifically focusing on rainfall data from the years 2016 to 2020. This guide will walk you through the entire process, from downloading the necessary data to visualizing the results in ArcMap.
The CHRS (Climate Hazards Group InfraRed Precipitation with Station data) data portal provides access to various rainfall datasets. For our purpose, we will be using this portal to download daily rainfall data for a specific region in India, which we will then use to calculate the average annual rainfall.
To begin, you need to access the CHRS data portal. You can do this by searching for "CHRS data portal" on Google. Once on the portal, follow these steps:
Once you receive the data, extract the files and organize them in a folder for easy access.
After downloading and extracting the rainfall data, the next step is to set it up in ArcMap:
To calculate the average annual rainfall from the five years of data, follow these steps:
Open Raster Calculator: In the ArcMap toolbox, navigate to Spatial Analyst Tools > Map Algebra > Raster Calculator.
Input the Formula: Use the formula to calculate the average:
(Rainfall_2017 + Rainfall_2018 + Rainfall_2019 + Rainfall_2020 + Rainfall_2021) / 5
Make sure to replace the layer names with the actual names of your rainfall layers.
Specify Output Location: Choose a location to save the output file, naming it "average_rainfall.tif".
Run the Calculation: Click OK to execute the calculation.
If you want to focus on a specific district, such as Aurangabad, you can extract that area from the average rainfall map:
To enhance the resolution of the rainfall data, you can convert the raster data to point data and apply the Inverse Distance Weighting (IDW) method:
Once you have generated the high-resolution rainfall map, you can visualize it:
Creating an average annual rainfall map using CHRS data is a straightforward process that involves downloading data, processing it in ArcMap, and visualizing the results. By following the steps outlined in this guide, you can generate accurate rainfall maps for any region of interest. If you have any questions or need further assistance, feel free to leave a comment below.