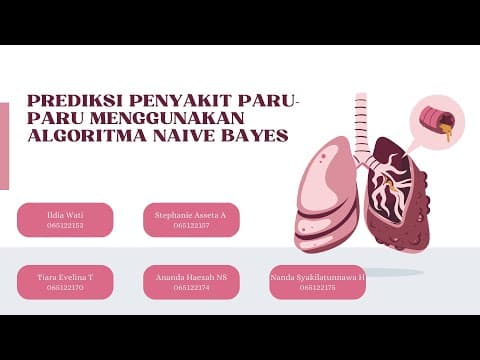
Lung diseases, particularly Chronic Obstructive Pulmonary Disease (COPD), are projected to be one of the leading causes of global mortality according to the World Health Organization (WHO). Factors such as age, smoking habits, physical activity, and medical history significantly influence the risk of developing these diseases. In this context, the Naive Bayes algorithm, which utilizes probabilistic methods, emerges as an efficient solution for analyzing risk factors and predicting the likelihood of lung diseases swiftly.
Project Objectives
The primary goal of this project is to develop a predictive model based on the Naive Bayes algorithm to assist in the accurate and efficient diagnosis of lung diseases. This model aims to support early detection, prompt treatment, and informed medical decision-making, ultimately enhancing the quality of life for individuals.
Specific Objectives
- Data Collection: Gather relevant datasets related to symptoms and diagnoses of lung diseases.
- Data Preprocessing: Enhance the quality of the dataset through preprocessing steps.
- Model Development: Build and evaluate a predictive model using the Naive Bayes algorithm.
- Result Visualization: Provide visual representations of prediction outcomes for easier interpretation.
Methodology
Data Sources
The project utilizes secondary data obtained from the Kaggle platform, specifically a dataset titled "Predicting Lung Disease". This dataset comprises 30,000 patient records, including information on symptoms, medical history, and diagnosis results.
Data Attributes
The dataset includes various attributes:
- Age (categorical)
- Gender (categorical)
- Smoking status (categorical)
- Occupational exposure (categorical)
- Physical activity (categorical)
- Insurance status (categorical)
- Pre-existing conditions (categorical)
- Diagnosis result (categorical)
Analysis Techniques
The analysis employs the Naive Bayes algorithm, which combines prior probabilities with new information to generate predictions. The tools and technologies used include Google Colab and Python programming language.
Project Plan
The project follows several key phases:
- Data Collection: The dataset is sourced from Kaggle, containing comprehensive patient information.
- Data Processing: This phase involves cleaning the data to handle missing values and transforming it into a suitable format for analysis. The dataset is then split into training and testing sets.
- Analysis: The Naive Bayes algorithm is applied to compute the probabilities of each outcome based on the input features.
- Evaluation: The model's performance is assessed to determine its predictive accuracy.
- Visualization: Various visualizations are created to understand patterns and distributions within the dataset.
Data Processing Steps
- Importing Libraries: Essential libraries such as Pandas, NumPy, and Matplotlib are imported.
- Uploading Data: The dataset is uploaded for analysis.
- Data Exploration: The first five rows of the dataset are displayed to understand its structure.
- Categorical to Numeric Conversion: Categorical variables are converted into numeric formats to facilitate analysis.
- Feature and Label Separation: Features (X) and labels (Y) are defined, with Y representing the target column.
- Dataset Splitting: The dataset is divided into training (80%) and testing (20%) sets.
- Model Training: The Naive Bayes model is trained using the Gaussian variant.
- Prediction: Predictions are made on the test data.
Model Evaluation
The model's accuracy is calculated, yielding an impressive accuracy rate of 88%. This indicates that the model correctly predicts 88% of the test data.
Classification Report
- Precision: 88% for false class, 87% for true class.
- Recall: 88% for false class, 87% for true class.
- F1 Score: 87% for both classes, indicating a balanced performance.
Confusion Matrix
The confusion matrix reveals:
- True Negatives: 2705
- False Positives: 370
- False Negatives: 380
- True Positives: 2545
Visualization of Results
- Confusion Matrix Heatmap: A heatmap visualizes the confusion matrix, highlighting the model's prediction accuracy.
- Precision and F1 Score Bar Plot: This plot illustrates the precision and F1 scores for each class.
- Learning Curve: The learning curve shows the model's accuracy on training and validation datasets across varying training sizes.
Conclusion
The analysis concludes that:
- The model achieves a high accuracy of 88%, demonstrating its effectiveness in predicting lung diseases.
- There is a balanced performance in precision, recall, and F1 score across both classes, indicating reliability.
- The model exhibits good generalization capabilities, avoiding overfitting or underfitting.
- The prediction errors are minimal compared to correct predictions, showcasing the model's robustness.
In summary, the Naive Bayes algorithm proves to be an effective tool for predicting lung diseases, offering stable and balanced performance in medical decision-making.