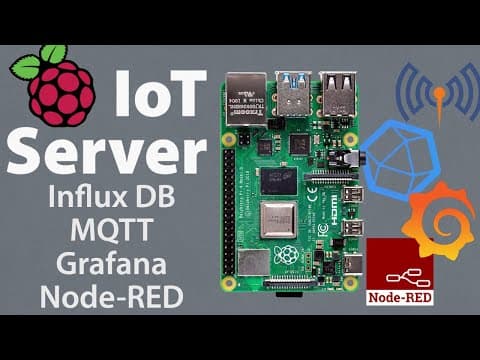
In this tutorial, we will create a Raspberry Pi IoT (Internet of Things) server that allows you to collect sensor data, send it over your network, and visualize it on a Grafana dashboard. We will use an Arduino Uno paired with a BME 680 sensor to collect temperature, pressure, humidity, and air quality data every two seconds. This data will be sent to the Raspberry Pi server using the MQTT messaging protocol.
Overview of the System
The system consists of several components:
- Sensor Nodes: These collect data and send it to the Raspberry Pi server.
- MQTT Protocol: This protocol allows clients to publish data to a broker (in our case, Mosquitto), which then forwards the data to subscribed clients.
- Node-RED: This application subscribes to the MQTT topic, interprets the JSON message data, and sends it to a database for storage.
- InfluxDB: This is the database where sensor data will be stored.
- Grafana: This front-end application queries the database and displays the data in a user-friendly format.
Required Applications
To set up the Raspberry Pi server, we will need the following applications:
- Mosquitto (MQTT broker)
- Node-RED
- InfluxDB
- Grafana
- Portainer (for managing Docker containers)
All these applications will be run inside Docker containers, which simplifies deployment and management.
Setting Up the Raspberry Pi
Prerequisites
- A Raspberry Pi with a fresh install of headless Raspbian OS (64-bit light version).
- SSH enabled on the Raspberry Pi.
- A static IP address configured for the Raspberry Pi.
Initial Setup
- Update the System: Run the following commands to update your Raspberry Pi:
sudo apt update
sudo apt upgrade
- Download IoT Stack: Use the following command to download IoT Stack, which will also install Docker and Docker Compose:
curl -sSL https://get.docker.com | sh
Follow any prompts to install necessary packages.
- Restart the Raspberry Pi: After installation, restart your Raspberry Pi to set environment variables:
sudo shutdown -r now
Building the Stack
- Log Back In: After the restart, log back into your Raspberry Pi.
- Navigate to IoT Stack Folder: Enter the IoT Stack folder and open the menu:
cd iot-stack
./menu.sh
- Select Packages: Choose the applications you want to install (Grafana, InfluxDB, Mosquitto, Node-RED, Portainer) using the arrow keys and spacebar.
- Build the Stack: After selecting the components, press enter to build the stack.
- Start the Stack: Navigate to the Docker commands section and select "start stack" to start all containers.
Configuring InfluxDB
- Create a Database: Access the InfluxDB container and create a database for storing sensor data:
docker exec -it influxdb influx
create database sensor_data
quit
Configuring Node-RED
- Access Node-RED: Open a web browser and navigate to the Raspberry Pi's IP address with port 1880.
- Build a Workflow: Drag and drop the following nodes from the left panel:
- MQTT input
- Change node
- InfluxDB output
- Configure MQTT Input: Double-click the MQTT input node, add the server (Raspberry Pi IP), and set the topic (e.g., /home/sensors).
- Configure Change Node: Set it to convert the incoming message to a JSON expression.
- Configure InfluxDB Output: Set the server IP, port (8086), and database name (sensor_data). Name the measurement as desired.
- Deploy the Configuration: Click the deploy button to save and implement the configuration.
Setting Up Grafana
- Access Grafana: Open a web browser and navigate to the Raspberry Pi's IP address with port 3000. Log in with the default credentials (admin/admin) and change the password.
- Add Data Source: Go to the data sources section, select InfluxDB, and enter the server IP, port (8086), and database name (sensor_data). Save and test the connection.
- Create a Dashboard: Select "Create new dashboard" and add panels for each measurement you want to visualize. Configure the panels to display the desired data.
- Save the Dashboard: Ensure to save your dashboard to avoid losing your configuration.
Conclusion
You have now successfully created a Raspberry Pi IoT server that collects sensor data using MQTT and visualizes it on a Grafana dashboard. This setup allows for real-time monitoring of various environmental parameters. For detailed commands and further assistance, refer to the written guide linked in the description. If you found this tutorial helpful, consider subscribing for more IoT-related content and let us know how you plan to use your IoT server in the comments.