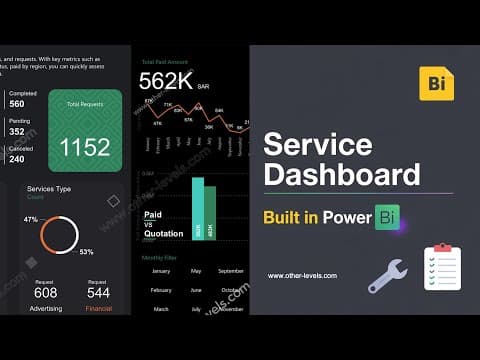
This blog post provides a comprehensive guide on how to create a Service Requests Management Dashboard using Microsoft Power BI, detailing the steps for data import, visualization, and dashboard design.
Welcome to the next level of data visualization! In this tutorial, we will explore how to create a comprehensive Service Requests Management Dashboard using Microsoft Power BI. This dashboard will include various visualizations such as total requests over the year, average daily requests, pending and canceled requests, total grants, and amounts paid by month.
The dashboard will feature the following key components:
You can download the dataset for this dashboard for free from our website, and templates are available for purchase at www.other-levels.com.
To start, we will import three Excel files into Power BI:
Once the data is imported, you will see three tabs on the left: Report, Data, and Model. Start with the Data tab to review all imported files.
Power BI can automatically create relationships between tables based on unique request numbers. To manually create relationships, drag the column header from one Excel file to the corresponding column in another file.
Insert a text box for the dashboard title and adjust its size and position. You can also add your company logo next to the title for branding purposes.
To calculate average daily requests, create a new measure:
Go to the Table tab and select "New Measure".
Use the following formula to calculate average daily requests:
Average Daily Requests = AVERAGEX(VALUES(Date[Date]), COUNTROWS(Requests))
To show the count of requests by status:
After adding all necessary visualizations, ensure that each element is properly formatted and positioned. Adjust the sizes, colors, and labels to create a cohesive look for your dashboard.
This tutorial has guided you through the process of creating a Service Requests Management Dashboard using Microsoft Power BI. By following these steps, you can effectively visualize and manage service requests, providing valuable insights for your organization. For those interested in purchasing templates or accessing additional resources, visit our website at www.other-levels.com. Thank you for joining us, and we hope to see you in the next video!