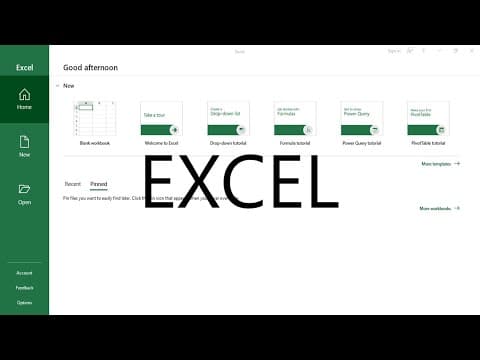
This blog post provides a detailed overview of Microsoft Excel, covering essential terminologies, functionalities, and practical examples to help users understand and utilize Excel for data analysis and visualization effectively.
Microsoft Excel, part of the Microsoft Office suite, is a powerful spreadsheet software that facilitates calculation, graphing, pivot tables, and macro programming, typically using Visual Basic. This guide aims to empower users with the fundamental concepts and functionalities of Excel, particularly focusing on its application in data analysis and visualization.
To effectively use Excel, it is crucial to understand some basic terminologies associated with the software.
A spreadsheet is essentially a sheet of paper that displays data in rows and columns. When you open Excel, what you see on the screen is a spreadsheet, resembling a sheet of paper organized into rows and columns.
A workbook refers to an Excel spreadsheet file. It houses all the data that the user has provided. In simpler terms, a workbook is the Excel file itself.
Worksheets are the individual spreadsheets found within a workbook. This is where users input or enter data. Worksheets are grouped together and can be seen at the lower part of the workbook. By default, older versions of Excel come with three worksheets, but users can create additional ones as needed.
A cell is the intersection of a row and a column, much like a coordinate. It is the specific location where data is entered. For example, cell A1 is the first cell in the first row and first column.
To illustrate data entry, let’s input fixed values into the cells starting from A1:
For example, cell A1 contains the value 1, cell B2 contains 6, cell C3 contains 11, and cell D4 contains 16.
The formula bar, located at the top of the worksheet, displays the content of the active or selected cell, including its values, formulas, or functions.
A formula in Excel begins with an equal sign and can represent a fixed value or a mathematical expression. For example:
=1 + 2 results in 3.=10 - 5 results in 5.=A1 + C3 + 3 results in 15 (1 + 11 + 3).Excel supports various mathematical operations, including addition, subtraction, multiplication, and division, similar to a calculator.
Functions are pre-built formulas in Excel designed to simplify complex calculations. Some common functions include:
A cell range is a collection of cells grouped together using a colon. For example, A1:A4 refers to cells A1, A2, A3, and A4. To calculate the sum of a range, you can use:
=SUM(A1:A4) which would yield 28.
Alternatively, you can manually add the cells:
=A1 + A2 + A3 + A4 which also results in 28.
Excel allows users to copy formulas easily. If you notice a small green square at the bottom of a highlighted cell, you can click and drag it to copy the formula across adjacent cells. For instance, dragging from A5 to D5 will replicate the formula while adjusting the cell references accordingly.
To calculate an average, you can use:
=(A1 + B5 + C5 + D5) / 16 which gives an average of 8.5.
To simplify this, you can use the AVERAGE function:
=AVERAGE(A1:D4) which also results in 8.5.
Understanding the basics of Excel is essential for anyone looking to analyze and visualize data effectively. By familiarizing yourself with the key terminologies, functionalities, and practical examples provided in this guide, you can harness the power of Excel to enhance your data management skills and improve your productivity.