This blog post provides a comprehensive overview of running a multiple regression analysis using STATA, focusing on the least squares regression method. It covers the setup of the data, the execution of the regression model, interpretation of the output, and the significance of various predictors in relation to student achievement.
In this blog post, we will explore the process of running a multiple regression analysis using STATA, specifically focusing on the least squares regression method. This analysis will help us understand how various predictors influence a dependent variable—in this case, student achievement.
Multiple regression is a statistical technique that allows us to examine the relationship between one dependent variable and multiple independent variables. In our example, we will analyze how gender, subject matter interest, mastery goals, and anxiety predict student achievement.
Before running the regression analysis, we need to ensure that our data is properly set up in STATA. The dataset includes the following variables:
For this analysis, we are assuming a sample size of 50 students.
To run a basic simultaneous multiple regression using STATA, we can utilize the drop-down menus:
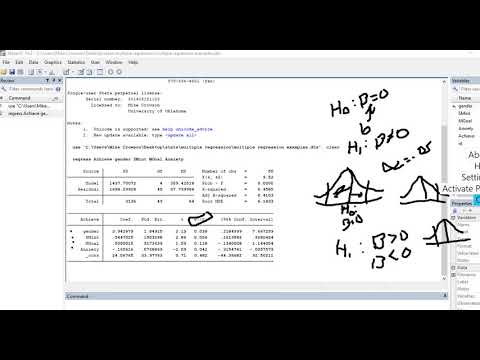
Upon running the regression, we receive several key outputs:
The ANOVA summary table provides insights into the regression model:
The regression coefficients (denoted as B) indicate the relationship between each predictor and the dependent variable:
To determine the significance of each predictor, we compare the p-values against a significance level (alpha), typically set at 0.05. If the p-value is less than 0.05, we reject the null hypothesis that the population regression coefficient is equal to zero. In our analysis:
Confidence intervals provide an interval estimate of the population regression coefficients. If zero falls within the interval, the predictor is not statistically significant. In our case, the confidence intervals for Gender, Subject Matter Interest, and Anxiety do not include zero, confirming their significance.
To compare the relative contributions of each predictor, we can request standardized regression coefficients (beta coefficients). These coefficients allow us to rank the predictors based on their impact on achievement:
In summary, we have successfully run a multiple regression analysis using STATA to explore the predictors of student achievement. The analysis revealed significant relationships between achievement and gender, subject matter interest, and anxiety, while mastery goals did not show a significant effect. Understanding these relationships can help educators and researchers develop strategies to enhance student performance based on these predictors.
This overview serves as a foundational guide for conducting multiple regression analysis in STATA, emphasizing the importance of interpreting the output correctly to draw meaningful conclusions from the data.